Optimizing SSR performance: How we cut blank-screen time with progressive rendering
Learn how GetYourGuide slashed blank-screen time by 450ms with streaming server-side rendering. Unpack the methods that led to faster pages and higher conversions for travelers worldwide.


Key takeaways:
GetYourGuide helps travelers all over the world discover and book tours, activities, and experiences. And all those journeys start on our landing pages.
They’re the first thing millions of users see every month, often arriving from search engines and always expecting a fast experience. But it took ~800ms before they saw anything on the page. That’s almost a full second of staring at a blank screen.
Software Engineer Venugopal Sundaram and his team found a way to cut that in half. Dive in to find out how.
{{divider}}
Some context on our architecture
Our frontend runs as a Vue 3 SSR application on Node.js. It doesn’t own page content directly — instead, for every request, it calls an internal Server-Driven UI (SDUI) service that returns a JSON blueprint of the entire page: layout, components, content, metadata, SEO config, tracking. The frontend takes that blueprint and turns it into <code>HTML</code>.
This gives product teams enormous flexibility. They can reshape pages and run experiments without frontend deployments. But it also means every single page render is blocked on a network call to SDUI, and that call sits on the critical path.
What was happening
The pipeline was entirely sequential:
- Call SDUI. Wait for the complete blueprint. (~500ms at p90)
- Parse it. Populate application state.
- Run Vue’s renderToString to produce the full <code>HTML</code>. (~120ms at p90)
- Serialize everything — <code>HTML</code> plus hydration state.
- Send the response.
Nothing left the server until step 5. The browser sat idle for ~700ms of server-side work, and with network latency on top, real-user TTFB landed around ~800ms at p75.
The cascade from there was predictable. The <head> — with all the CSS and JS links the browser needs — was trapped inside the buffered response. FCP couldn’t happen until assets started loading. LCP couldn’t happen until CSS was parsed and applied. Every metric waited in line.
Meanwhile, renderToString was holding the entire <code>HTML</code> document in memory per request. At our traffic levels, that added real pressure — memory allocation that couldn’t be freed until the response was written, plus ~120ms of main-thread CPU time that compounded non-linearly under load.
Where was the time going?
When we actually traced the ~800ms, it split cleanly into two problems that had nothing to do with each other.
- ~120ms was the frontend’s own overhead. Even after SDUI responded, the server spent time building the full <code>HTML</code> in memory, serializing state, and initializing compression. All sequential. All before sending a single byte.
- ~500ms was waiting for SDUI. The frontend needed the complete blueprint before it could begin any work — but the blueprint isn’t a monolith. The header doesn’t depend on the layout. The SEO metadata doesn’t depend on the navigation. There was no reason to wait for everything before sending anything.
Two problems, two workstreams.
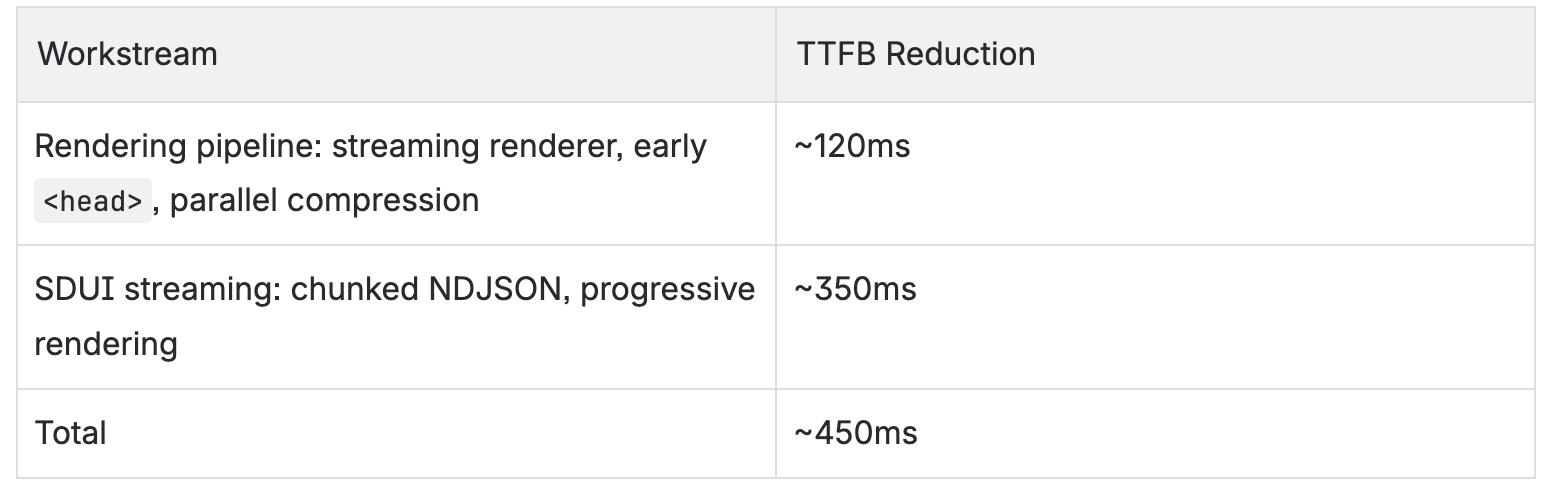
The rendering pipeline (~120ms saved)
We started with the part we fully controlled.
The old pipeline rendered everything into a string, then sent it. We switched to a streaming renderer — <code>HTML</code> flows to the response as components are rendered, rather than being assembled in full first. Lower memory per request, and the browser starts receiving data sooner.
The bigger win was structural. The <code>HTML</code> <head> — titles, canonical URLs, stylesheet, and script references — is entirely determined by SDUI data we already have before rendering the body. There’s no reason to wait for renderToString to finish before sending it. So we stopped waiting. The <head> goes out first, with preload headers for critical assets. The browser starts fetching CSS and JS immediately. The server keeps rendering. Client and server are working in parallel instead of taking turns.
We also moved the compression setup off the critical path. Initializing gzip/brotli was happening after all data was ready — ~80ms of pure dead time. Now it initializes in parallel with the SDUI fetch. By the time data is ready to send, the compression pipeline is already warm.
SDUI streaming (~350ms Saved)
This was the bigger bet. The frontend waited ~500ms for a complete JSON response, even though most of that response could have been useful as soon as individual pieces were ready.
The key insight: every property in the SDUI blueprint is independent. Header, navigation, layout, metadata, tracking — none of them depend on each other. If SDUI could emit them as a stream, the frontend could start working from the first chunk instead of the last.
How the stream works
SDUI now emits the blueprint as Newline Delimited JSON (NDJSON) — each line a self-contained JSON object representing one logical part of the page:
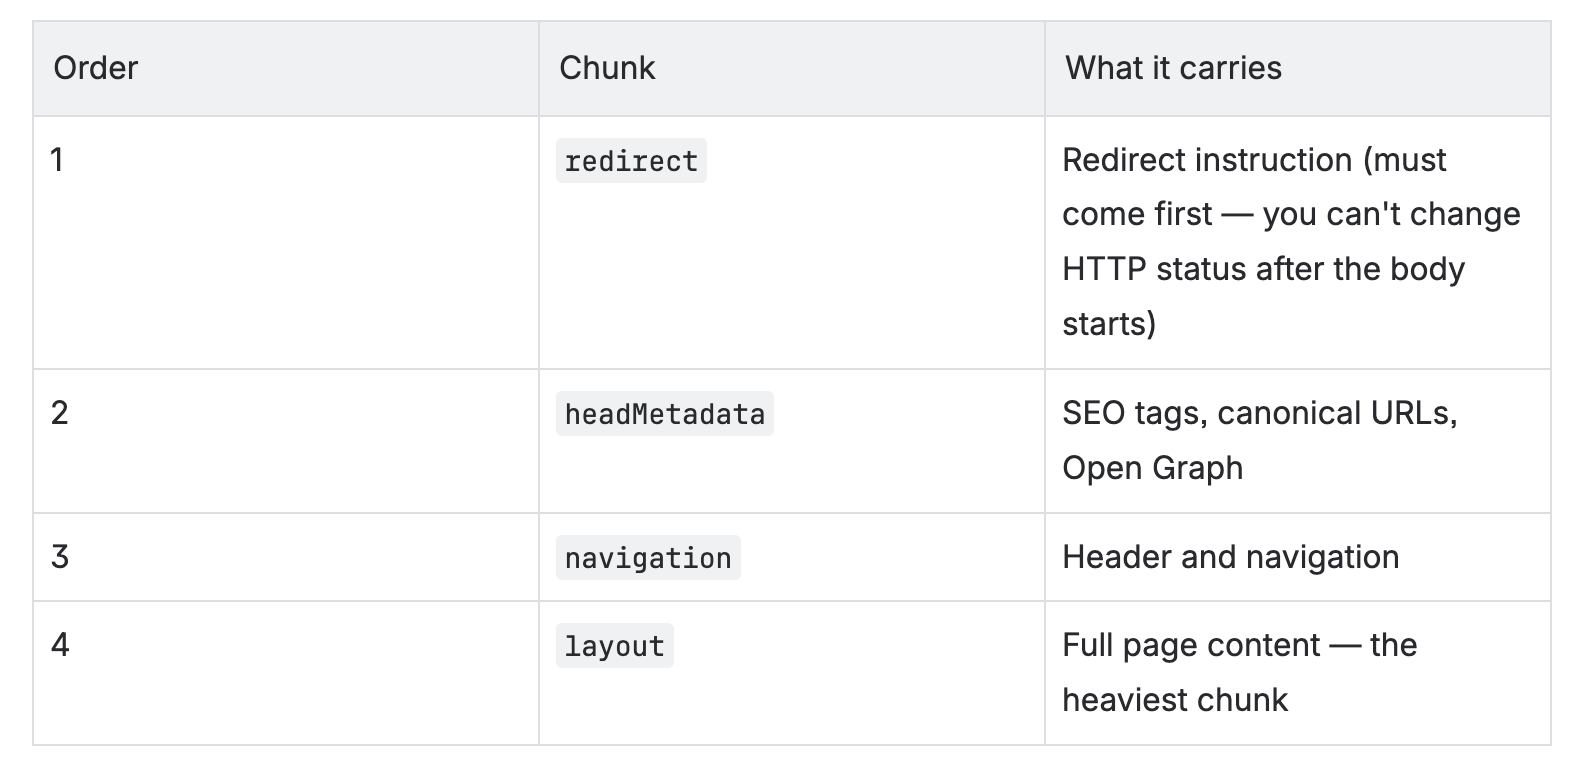
The ordering is deliberate. Redirect comes first due to HTTP requirements. Head metadata and navigation come next because they’re what the browser needs to start doing useful work. Layout — the chunk that takes SDUI the longest to assemble — arrives last, by which point the page shell is already in the browser.
One rule we’ve enforced from day one: every logical property gets its own chunk. New properties must be new chunk types. This keeps the protocol extensible without ambiguity.
What the frontend does with it
Instead of waiting for the full blueprint, the frontend now registers handlers per chunk type and reacts as data arrives.
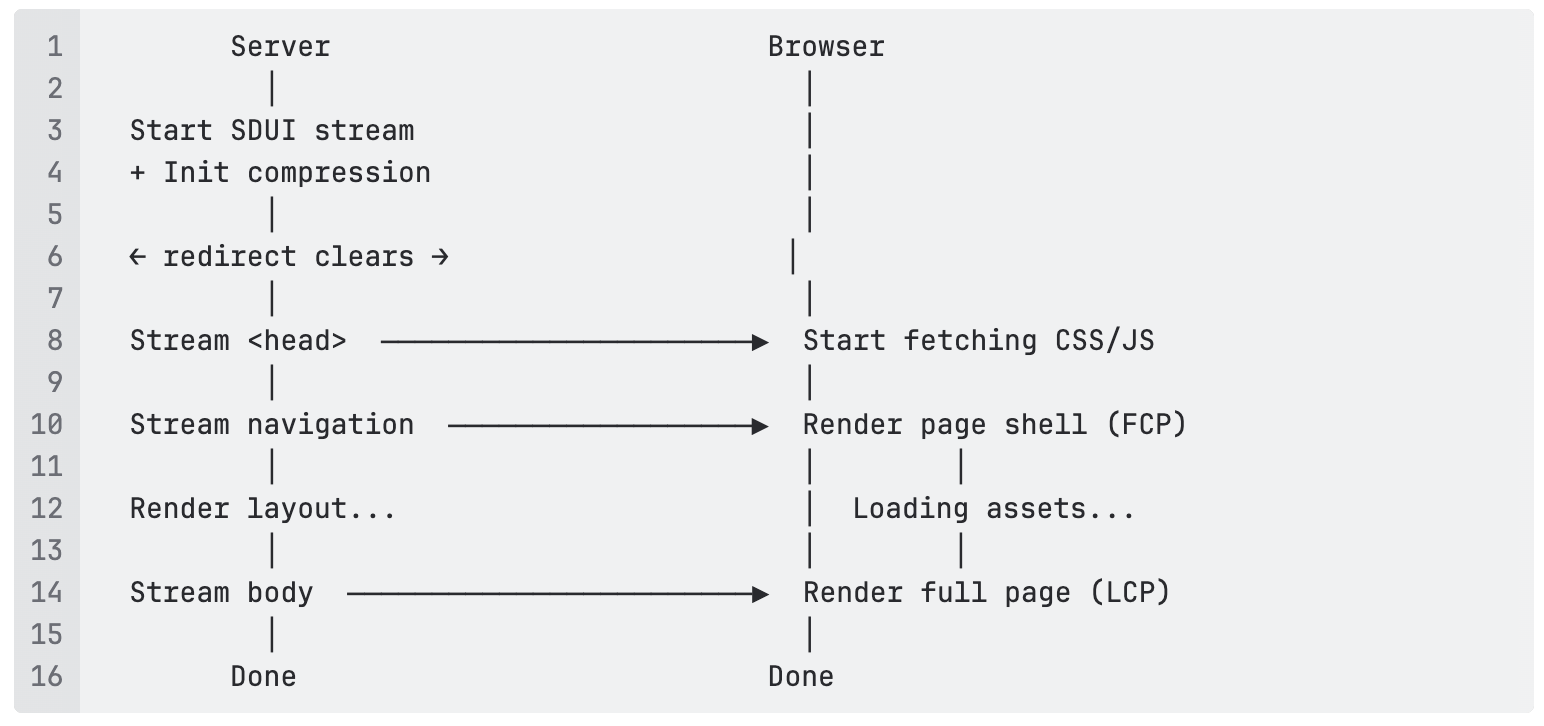
The moment the redirect chunk clears (no redirect needed), the HTTP response starts streaming — before anything else has arrived. When headMetadata lands, the <head> goes out: SEO tags, asset preloads. This is the TTFB moment. The browser starts fetching CSS and JS while the server is still waiting for layout data.
When navigation arrives, the page shell renders: header, nav, and skeleton placeholders. Users see a real page taking shape. When layout finally arrives, the body fills in. By then, the browser will already have most assets loaded from the parallel fetches it kicked off minutes ago (in browser time).
One problem we had to solve
The old approach for generating CSS and JS preload links relied on inspecting Vue’s render context after renderToString finished. That obviously doesn’t work when you need those links before rendering starts.
We solved it with the build manifest—a JSON file generated by the build step that maps each route to its asset dependencies. At request time, a manifest lookup replaces the render-time inspection. For above-the-fold content, we maintain per-route critical asset lists so the most important resources are always preloaded first.
Did it actually work?
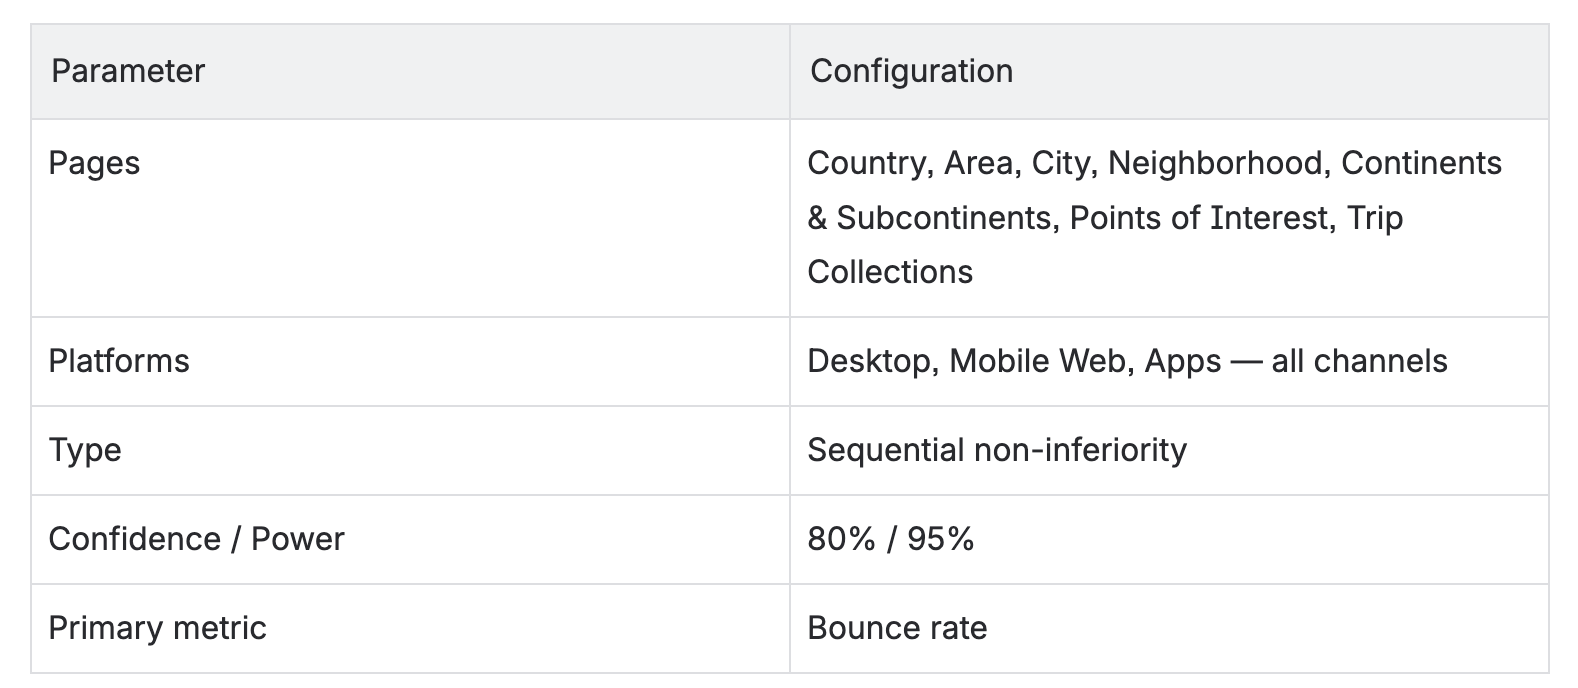
We ran an A/B experiment across all landing page types before making streaming the default.
A validity wrinkle
Midway through, we noticed that the session counts between the control and treatment groups diverged by 0.779% — an order of magnitude larger than the 0.056% maximum we’d seen in our previous seven experiments.
The likely cause: faster TTFB meant our tracking scripts loaded sooner in the treatment group. Users who would have left before any tracking event fired were now being counted as sessions. The performance improvement was changing the experiment’s own denominator.
We reran the analysis on raw assignment-level data rather than session-aggregated metrics. If you’re planning a web performance experiment, build this fallback into your analysis workflow from the start.
What the numbers said
One important caveat: the rendering pipeline work (~120ms) shipped globally before the experiment, since it carried no functional risk. The experiment isolated SDUI streaming only — both variants were already running on the optimized pipeline.
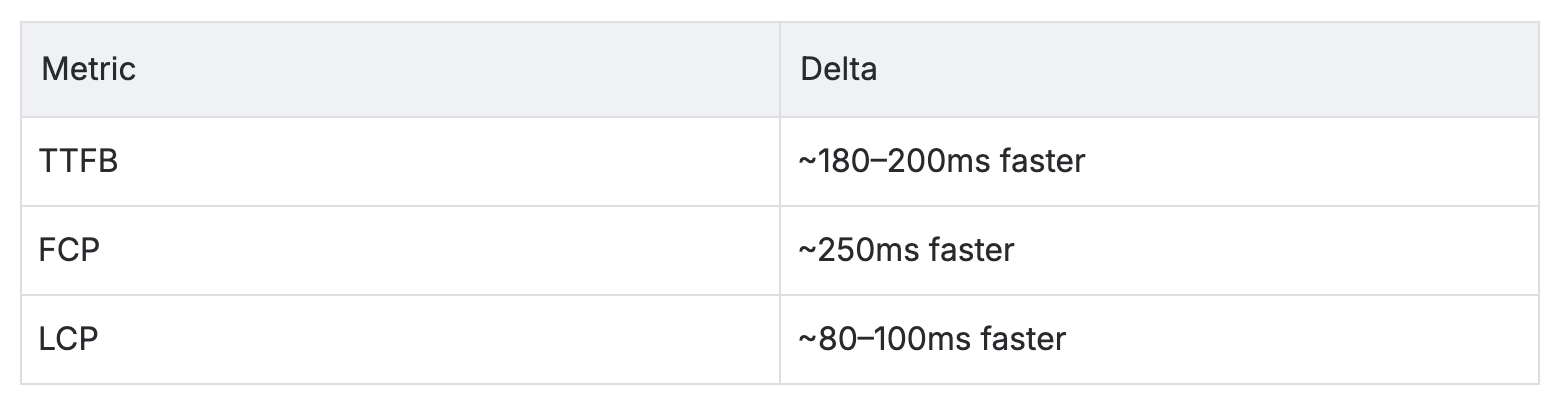
The full ~450ms improvement is the combined gain of both workstreams relative to the original baseline.
Business impact
GetYourGuide is a marketplace for tours and activities. A traveler’s journey on a landing page flows from browsing to checking prices and dates to adding something to their cart to booking. Here’s where the needle moved:
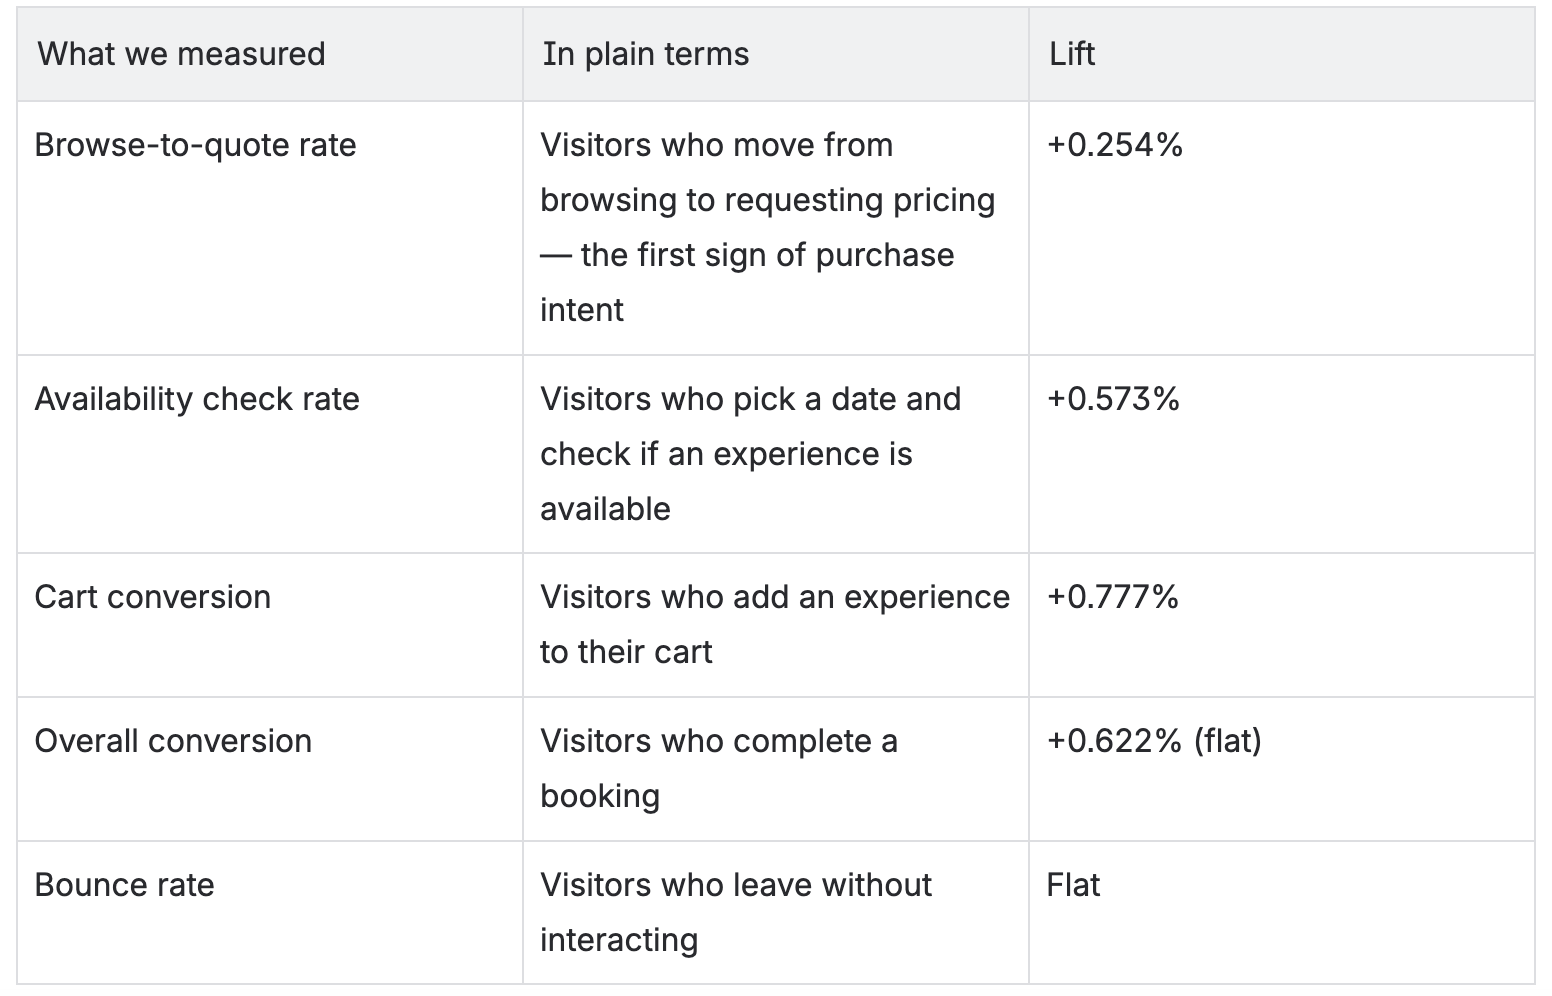
The hypothesis we started with — that faster page load speeds reduce bounce rate — didn’t hold. But the mid-funnel story was clear and consistent: users who engaged with the page went meaningfully deeper. The faster experience didn’t change whether people stayed. It changed what they did once they stayed.
The 5x trade-off
Worth being honest about: once you start streaming, the HTTP status code is set in stone. If a server error happens mid-render, the 200 you already sent can’t become a 500.
In practice, this affected ~0.02% of requests over a one-month window. We accepted the tradeoff for user traffic and addressed the SEO risk by routing bots and crawlers through a non-streaming path that preserves accurate status codes.
How it all fits together
What we took away
The ~800ms wasn’t one problem. It was two unrelated problems hiding behind the same symptom. The frontend’s rendering overhead and the SDUI wait required completely different solutions, and treating TTFB as a single thing to fix would have led us to half-measures. Decompose before you design.
The content of our response didn’t change — the same bytes, the same data. What changed was when each piece arrived. Sending the <head> 500ms earlier made the browser’s pipeline run in parallel. Sometimes the most effective optimization isn’t making things faster; it’s rearranging when things happen.
The mental model most of us carry for SSR — server finishes, then sends, then browser starts — is a simplification that costs real latency. Streaming replaces that with overlap: the browser fetches assets while the server is still rendering. Every millisecond of overlap is free. Any SSR application that buffers the full response before flushing it is leaving this on the table.
We were confident that the bounce rate would improve. It didn’t. But three mid-funnel metrics moved in the same direction, consistently, with statistical significance. If we’d anchored on the primary metric alone, we would have called the experiment neutral and walked away from real business value. Measure the full funnel. Let the data surprise you.
And if your experiment variants show a session count imbalance, don’t dismiss it as noise. Ours showed that session tracking itself was sensitive to TTFB — faster pages led to more sessions being counted before users left. That’s not a bug in the experiment. It’s a finding about your instrumentation.
The numbers
Starting from ~800ms, landing at ~350ms. Browse-to-quote rate up 0.254%. Availability checks up 0.573%. Cart conversion up 0.777%. Across all landing pages, all platforms.
The biggest gains came not from making operations faster, but from running them in parallel.
What’s next
LCP is the next target. The build manifest already tells us which assets each route needs — the next step is preloading above-the-fold assets in the very first streamed chunk, before rendering begins, closing the gap between TTFB and LCP that streaming narrowed but didn’t eliminate.
We now also have the infrastructure to show skeleton loading states within ~300ms before layout data arrives. This was the original UX motivation for the project and is the next milestone we’re shipping toward.
Finally, the experiment covered most landing page types, but not all of them. Search results, SEO-focused pages, and a few others were excluded. Extending streaming coverage is on the roadmap.
If you’re interested in solving problems like this alongside industry-leading tech talent, check out our open roles in tech.

More articles like this