From prototype to powerhouse: how we developed and scaled marketing experimentation tooling at GetYourGuide
Explore how GetYourGuide developed and scaled a custom marketing experimentation tool to drive smarter ad spend and data-driven decisions. Learn about our journey from prototype to a robust, self-service platform, the challenges we overcame, and the lessons that can help your team build impactful analytics solutions.

Senior Data Analyst, Marketing Analytics
.avif)
Key takeaways:
From prototype to powerhouse: how we developed and scaled marketing experimentation tooling at GetYourGuide
In today’s ad market, attention is hard to capture — so how and where you allocate your marketing budget matters. This article explores the collaborative process of building and implementing a customized marketing experimentation tool, empowering our teams to make informed decisions based on real data.
Over the years, this tool has undergone a significant transformation and has become integral to the way we experiment. Let’s dive into the core processes, critical challenges, and lessons learned along the way.
Challenges of marketing experimentation
One of the main challenges we face when measuring the impact of an ad campaign is that we lack control over who sees our ads due to privacy restrictions. This is where experimentation gets tricky and requires alternative approaches like “Lift Studies” offered by advertising platforms or quasi-experiments such as geo tests.
Additionally, our team discovered that standardized third-party solutions couldn’t be adapted to meet our specific business needs or handle end-to-end marketing experimentation. Therefore, we needed a bespoke approach.
Internal tooling to the rescue
Our Marketing Analytics Team quickly developed an in-house method for measuring marketing impact, enabling data analysts to design robust marketing experiments and accurately measure the impact of their interventions. Let’s look at how it works:
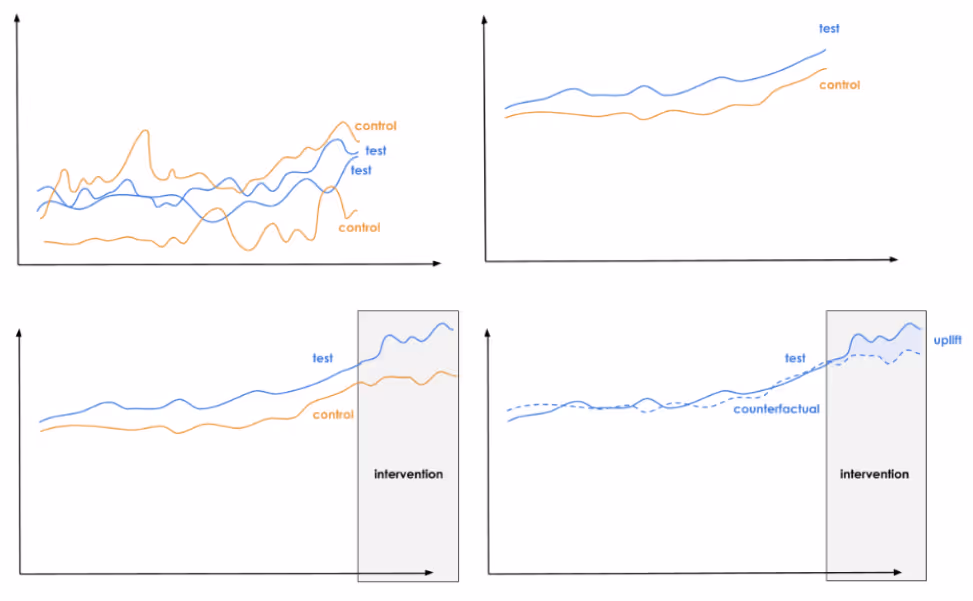
- Instead of assigning a single user to treatment or control, we can randomize groups of visitors — people with common characteristics, such as geography, campaign exposure, language, etc. — and measure the impact of the intervention on a cluster level.
- The random assignment of the group of visitors, also known as experimental units, to treatment and control is done hundreds of times.
- We aggregate the daily performance data (e.g, visitors) to form one treatment and one control group time series for each assignment and select the random assignment that has the most similar treatment and control trend in the pre-intervention period.
- After this, we apply the intervention (e.g, exposure to a new ad type) to the experimental units of the treatment group, while the other group serves as the control and remains untouched.
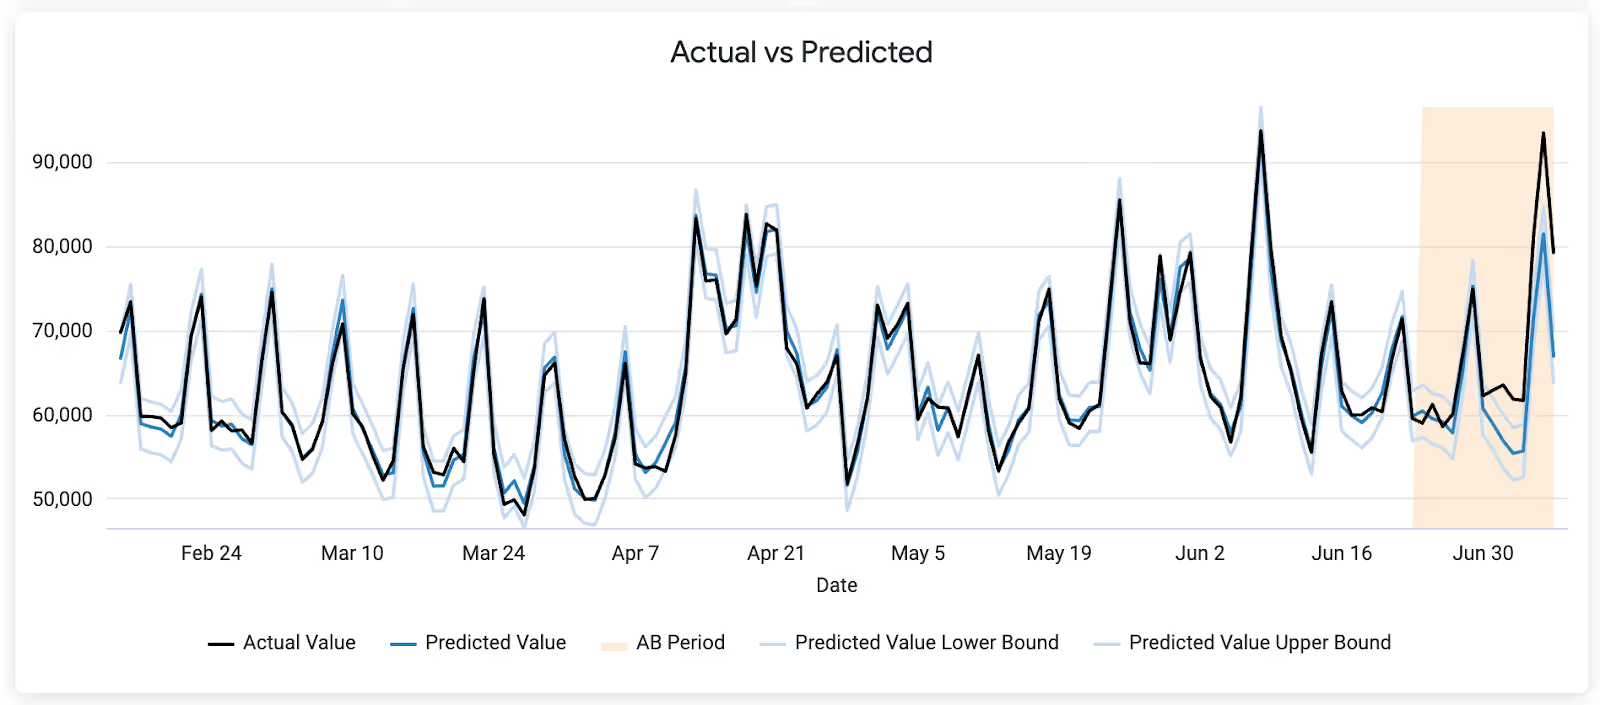
- For impact measurement, we use a Bayesian structural time series model (utilizing Google’s CausalImpact) to construct a counterfactual for the test group. The counterfactual estimates what would have happened to the test group’s metric during the experiment period if they had not received the intervention. By comparing the actual outcome to this counterfactual, we can calculate the impact, also known as the ‘lift’.
Our Analytics Manager, Valentin Mucke, developed the methodology and the first versions of the tool. If you’re interested in learning more about how it works in detail, check out his article on it here.
You can also learn more about how experimentation fits into our whole marketing measurement framework in this article from our Marketing Analytics Manager, Ahmed Ben El Cadi.
Getting the tool ready to scale
The proof-of-concept version of this tool proved its value for both marketing managers and data analysts by enabling an increase in the number of experiments to approximately 10 per quarter. The demand and use case ideas quickly increased, and the team realized that the tool developed and maintained by a single analyst serving a small number of experimental units was not enough; it needed to be scalable.
To achieve the highest possible impact across the organisation, we had to ensure that the tool supported a wide range of marketing channels and experimental units, while being easy to use by marketing managers without analyst involvement.
Reframing the tool as a product
We recognized that while our impact measurement method was solid, scaling an ad-hoc Databricks Notebook-based solution into a robust experimentation platform required a different approach. It meant treating the tool not as a one-off project, but as a real product.
To make this vision a reality, we shifted from relying on individual efforts to fostering collaboration across teams, with clear accountability and ownership. Additionally, we incorporated agile workflows, code reviews, a solid architecture for both front-end and back-end performance, and a roadmap for feature ideas. This ensured that the platform was designed to meet the evolving needs of its users.
Thanks to the collaboration across teams on this project, our tool underwent a remarkable transformation. It evolved from a limited scope with high analyst input requirements into a scalable, fully self-service platform with a user-friendly interface, empowering marketing managers to run experiments independently. Experiment setup and analysis now take minutes rather than the days or weeks required when experimenters relied entirely on analysts for support.
Where we are today
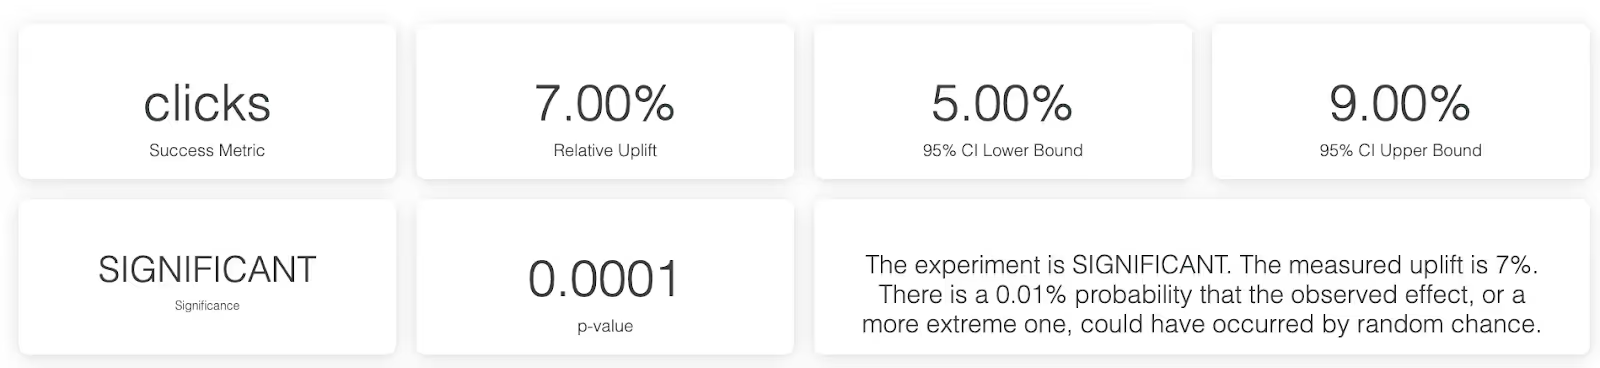
At the time of writing this article (November 2025), the platform supports eight marketing channels and accommodates various experimental units, enabling the testing of diverse treatment types. Features such as minimum detectable effect (MDE) calculations, runtime estimations, fixing test unit capabilities, and stratified sampling were added based on user feedback, ensuring the tool meets the dynamic needs of our organization.

To further improve runtime, scalability, and reliability, the entire architecture and related data pipelines were redesigned. We also introduced end-to-end testing to ensure robustness and created comprehensive technical documentation to facilitate onboarding for new contributors.
Key takeaways
This project was not without its roadblocks and challenges. Let’s explore the lessons they led to along the way.
Treat your tool as a data product with clear ownership
Initially, the tool was managed by a single analyst. As demand grew, it became evident that clear product ownership was crucial. We transitioned to a dedicated team, which not only increased the "bus factor" and reduced development time but also provided users with a clear point of contact for questions and feedback.
Start small and iterate
Starting with a Minimum Viable Product (MVP) or Proof of Concept (POC), rather than over-engineering from the outset, proved to be vital. This agile approach allowed us to validate business value with relatively low investment, gain buy-in, and gather essential user input and use case ideas. We also reduced the risk of shipping features that users did not need, keeping our efforts focused. Iterating based on feedback enabled us to tailor the tool to meet the needs of our users as we progressed.
Standardize to build trust and clarity
We enhanced the reliability of our experiments by implementing standardized measurement methodologies. Marketers benefited from clear, repeatable formats, moving away from ad-hoc analyses that were harder to digest. This shift ensured consistency in result interpretation while also simplifying the process of generating insights, enabling marketers to act faster on experiment outcomes.
Make the tool ‘self-service’
To reduce the burden on analysts, we designed the tool to be user-friendly and intuitive enough for marketing managers to use. Features were created to assist owners throughout their experiment’s lifecycle from setup to analysis. The team also collaborated with users early on to understand their pain points, gather feedback, and identify product champions who could promote and support broader adoption.
Push for architectural improvements
While rapid iteration is essential, allowing technical debt to accumulate for too long can severely hinder progress. A complex, patched solution increases the risk of faulty feature implementation later on, potentially leading to a loss of trust in the tool. Owners must proactively call for architectural improvements, as the pain points in development may not be apparent to other stakeholders.
Engage users to drive adoption
An engaged user base is essential for gathering feature requests that enhance the tool and drive adoption. One effective strategy is to identify champions within key marketing channels (such as paid search, in our case), who can advocate for experimentation and share success stories. Focusing on fewer, high-impact use cases early on and solving them well with an MVP helps showcase the tool’s value and build trust among users, boosting the organization’s appetite for experimentation.
By providing an easy-to-use experimentation tool, testing becomes a seamless part of decision-making rather than a bottleneck. Increased adoption not only enhances the tool but also builds a stronger culture of experimentation within the organization.
Use a roadmap to deliver impact
A clear plan enables the transparent prioritization of work, easy gathering of feedback, and ensures that your efforts stay focused on delivering the most impactful features for your users. Ensure that you identify dependencies, allocate resources effectively, and set realistic timelines to minimize ambiguity and foster collaboration across teams.
Conclusion
This transformation didn’t just represent a technical challenge but a cultural shift within the organization. This project is a testament to our culture of experimentation and how it’s enabling us to navigate our complex industry more efficiently than ever.
By sharing our journey, we hope to inspire and equip others to overcome challenges and create impactful tools that drive better decision-making. If you’re working on a similar project, we encourage you to embrace agility, engage users actively, and prioritize long-term value over short-term gains. Foster constant collaboration and unlock new opportunities to bring you closer to achieving your goals!
Acknowledgments
Thanks to Valentin Mucke for developing the initial methodology and tool, Nacho Rios, the Paid Search Product team, and every other colleague for their essential contributions to the product’s development. Finally, kudos to Agus Figueroa and Hussain Hayat for their help in writing this article, and Ahmed Ben El Cadi and Nacho again for their valuable reviews.
Want to be a part of a growing tech team changing the way the world travels? Check out our open roles here.

More articles like this